
No, the median American homebuyer is not 59 years old.
Viral data massively overestimates the age of the typical homebuyer.

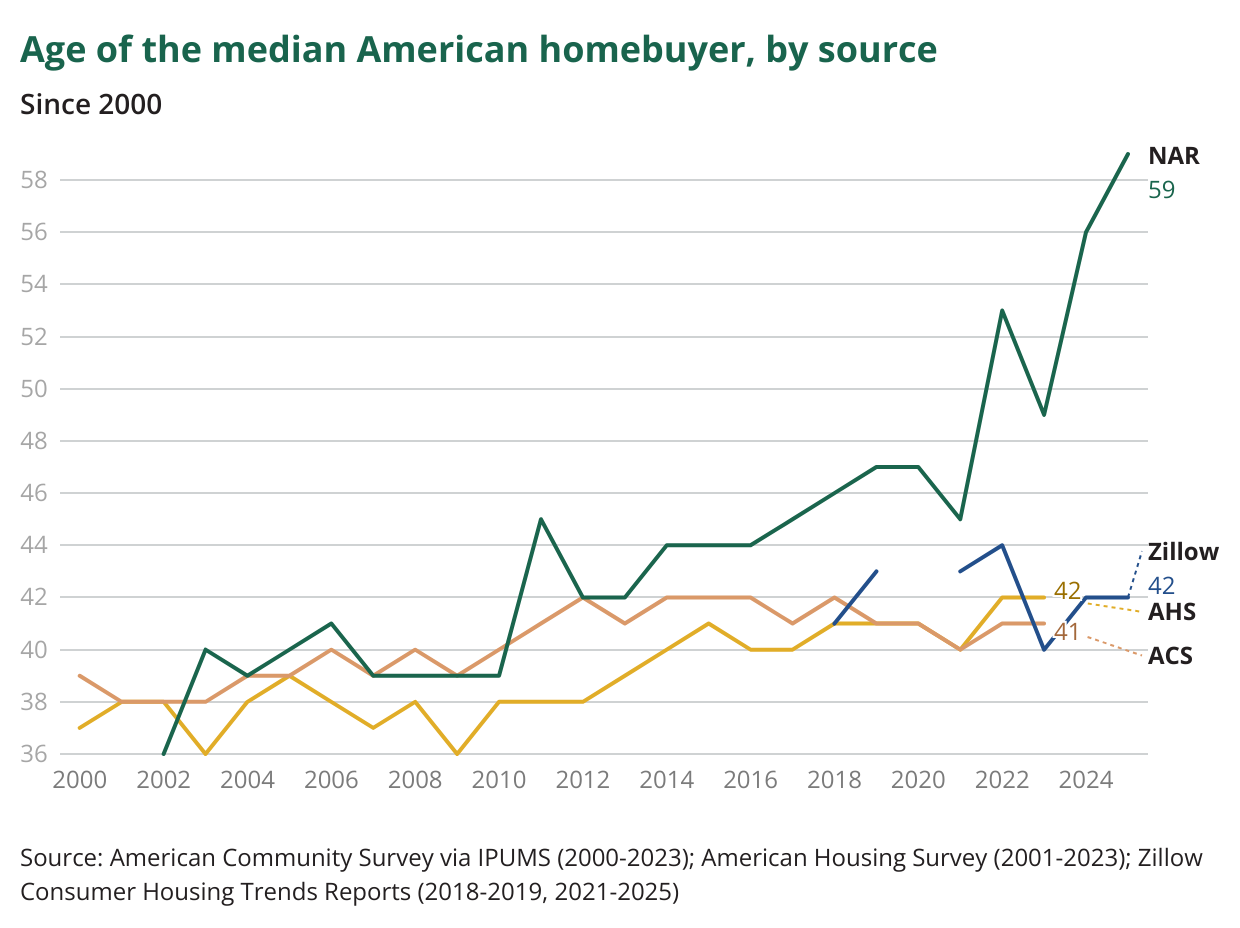
You have likely seen a startling statistic from the National Association of Realtors (NAR) over the past few weeks: the typical American homebuyer is now 59 years old, while the first-time buyer is 40. Both are record highs.
The finding, from an annual NAR survey of homebuyers, set off a social media firestorm and earned coverage in virtually every national media outlet. It also played into a burgeoning narrative that young Americans are screwed. Softening labor markets are colliding with long-simmering problems like student debt. Consumer sentiment among Americans under 35 is worse today than during the toughest days of the Great Recession. NAR’s survey provided yet more validation that young people are falling hopelessly behind.
But there is one problem with NAR’s data: It’s wildly wrong.
The National Association of Realtors likely overstates the age of the typical homebuyer by 15 to 20 years, while overestimating the age of the typical first-time buyer by between 5 and 10 years.
Much larger government-run surveys like the gold-standard American Housing Survey and American Community Survey show no increase whatsoever in the age of the typical homebuyer since the pandemic, when NAR’s median age estimate went truly vertical. My analysis of American Housing Survey data finds the median buyer in 2023 was 42. A similar estimate using 2023 American Community Survey data shows a median age of 41, unchanged for well over a decade.
While the National Association of Realtors’ survey was conducted more recently than those two, other recent data also cast doubt on its estimates. An analysis of mortgage data from the American Enterprise Institute and Cato Institute found that the median first-time homebuyer in 2024 was, at most, 34, unchanged since at least 2018. A large national survey of homebuyers conducted this summer by Zillow found the median overall homebuyer was 42 — 17 years younger than NAR’s estimate.
NAR’s survey and these other data do not measure precisely the same things. For instance, mortgage data would not capture all-cash transactions, whose market share has modestly increased over the past few years. But the American Housing Survey and American Community Survey cover all buyers, whether paying in cash or financing, so cash purchases don’t seem to explain the enormous divergence between NAR’s results and the other sources.
A representative of the National Association of Realtors offered another possible explanation to the Washington Post: that young buyers priced out of markets where they want to live are instead buying investment properties in cheaper markets and renting them out. They therefore don’t show up in NAR’s survey, which only covers primary residences. But NAR offered no concrete evidence that this was a widespread phenomenon, let alone one big enough to account for its claim that the typical buyer today is a full decade older than in 2023. And in my own analysis of ACS and AHS data, I filter only for owner-occupied units, making this point moot.
So what explains the disagreement? It could be caused by low response rates, a problem nagging survey-takers across the world. Adding to the baseline difficulty of getting responses from households, NAR’s survey is also very long — it asks 120 questions — and is conducted purely by mail. Its latest edition surveyed more than 170,000 households, but got responses from just 6,100. That is a rate of less than 4 percent, far lower than government surveys like the ACS or AHS. The NAR’s old-school survey-taking is exactly the kind of methodology that no longer holds up in a digital age.
Whatever the explanation, it’s certainly no mystery why the NAR results garnered far more attention than these other, high-quality estimates: We live in an information ecosystem where the most pessimistic data goes viral regardless of its quality. If a statistic directionally reinforces a compelling narrative — even if the degree of that narrative is wildly overstated — its flaws are largely ignored.
While NAR’s specific claims are massive outliers, housing affordability is indeed a growing problem, particularly for young people. Millennials and Gen Z are well behind prior generations in their rates of homeownership. The typical age of a first-time homebuyer does not appear to have risen nearly as much as the NAR estimates, but it has increased over the past few decades. This is in large part thanks to communities’ refusal to allow enough new housing construction.
Nationwide, the rate of new housing construction per capita has fallen by half since the 1970s, and has still not yet returned to pre-Great Recession levels. As a result, home prices in the 100 largest metros are five times the median income, pricing young families out of the market. Since 2020, the number of children under 5 has fallen a staggering 19 percent in New York City, 15 percent in San Francisco, and 14 percent in Los Angeles. Once engines of upward mobility, these so-called “superstar” cities have become so expensive that many families are simply leaving. Meanwhile, booming metros across the Sun Belt, where rules on new construction are generally more relaxed, are doing far better at attracting families and investment.
The most pessimistic, headline-grabbing housing market data points may be wrong, but the reaction they elicit speaks to something true: America simply isn’t building enough housing. Until that changes, the housing market is going to leave more young people behind.